

How to measure a building's energy performance
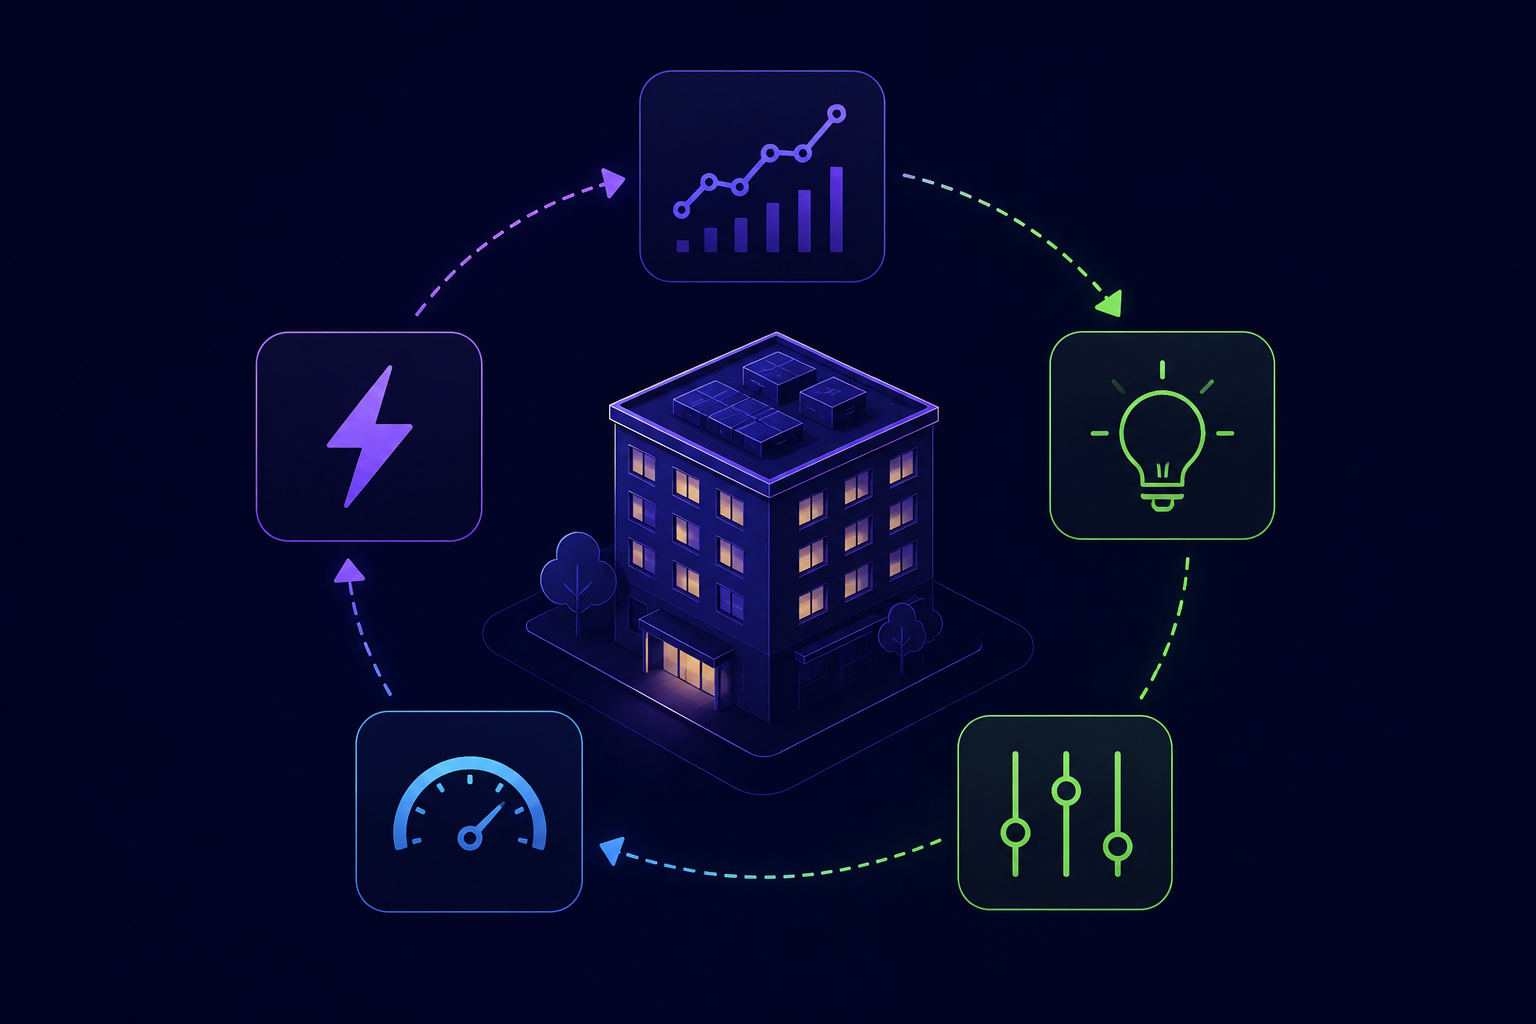
How to measure a building's energy performance: a 5-step method
You cannot effectively manage a building without measuring its energy performance. A manager who only has an annual energy bill is not managing energy efficiency; they are at its mercy. Between the sustained rise in energy prices, the Tertiary Decree requiring consumption reporting on OPERAT, and the BACS decree mandating automated control via a BMS (Building Management System), measurement is no longer an option for managers; it has become a regulatory obligation.
Here is a 5-step method to move from passive billing to active performance management, whether you manage a hotel, a portfolio of public buildings, or an industrial site:
- Define the right energy performance indicators (EPIs)
- Measure actual consumption, not theoretical
- Break down by usage and zone using sub-metering
- Adjust for climate and compare against a baseline
- Equip your monitoring, from spreadsheets to BMS
Step 1: Define the right energy performance indicators
The first instinct is to think in absolute values (kWh consumed per year). This is insufficient: raw consumption tells you nothing without a point of comparison, and above all, it says nothing about thebuilding's energy efficiency. Useful energy performance indicators (EPIs) are ratios
Consumption per surface area, in kWh/m²/year, is the benchmark indicator. It is the one used for the Tertiary Decree, for energy performance certificates (DPE), and the one that allows you to compare your buildings against each other and their category. An efficient office building consumes less than 100 kWh/m²/year in final energy. A hotel, with its domestic hot water and continuous operation, is logically higher.
Usage intensity indicators refine the analysis based on your activity: kWh per occupied room in a hotel, kWh per student in a school, kWh per unit produced in a factory. These are what distinguish a real performance drift from a simple increase in activity.
Economic and carbon indicators (€/m²/year, kgCO₂/m²/year) translate performance into the two languages spoken by executive management and CSR reporting.
Step 2: Measure actual consumption, not theoretical
An energy performance certificate (DPE) or a thermal study provides a theoretical consumption figure, calculated based on building characteristics. Actual performance, however, depends on usage: occupancy rates, behavior, settings, and weather. The gap between the two—the performance gap well known to energy experts—commonly reaches 30% to 50%.
Measuring performance means working with actual consumption data, recorded continuously. In practical terms, this means moving beyond monthly general meter readings to instrumenting the building: automatic index retrieval, hourly or sub-hourly time steps, and data history. This is precisely what a BMS (Building Management System) does: it continuously collects data from all connected equipment and turns it into an actionable analysis base.
Step 3: Break down by usage and zone using sub-metering
Overall consumption masks everything. The useful questions are: how much for heating? For air conditioning? For domestic hot water? For this building rather than that one, this floor, this kitchen?
Sub-metering (divisional meters by usage or zone, fed into the supervision system) is what turns an invoice into a diagnostic tool. It reveals that domestic hot water accounts for 25% of a hotel's bill, that a gym is heating all night, or that an AHU (Air Handling Unit) is running on weekends in an empty wing. Without sub-metering, you notice a drift; with it, you locate and correct it.
Sub-metering is also a financing issue: several aid and incentive schemes, including certain energy savings certificates (CEE), require consumption measured by MID-certified meters to prove the savings achieved. Instrumenting your building also means earning the right to capitalize on your efforts.
Step 4: Adjust for climate and compare to a baseline
Comparing January 2026 to January 2025 without precautions is a classic trap: if the winter was milder, the drop in consumption proves nothing. Climate correction via degree-days (HDD/CDD) allows you to neutralize the weather effect and compare like with like. This is, in fact, the logic behind the Tertiary Decree, which authorizes the adjustment of consumption based on climate.
The complete approach consists of establishing a baseline year (consumption measured over 12 representative months), then tracking deviations adjusted for climate and activity. This is the principle of measurement and verification protocols like IPMVP, used in energy performance contracts: without a solid baseline, it is impossible to prove savings to management, a financier, or the authorities.
A good measurement plan follows three horizons: real-time to detect anomalies (an alert when consumption falls outside its normal range), monthly to steer actions, and annual for regulatory trajectories and reporting.
Step 5: Equip your monitoring, from spreadsheets to supervision
Many managers start with a manually updated spreadsheet. It is better than nothing, but it is destined to run out of steam: time-consuming entry, monthly data too coarse to detect drifts, no alerts, and a file that dies when its author leaves.
The next step is energy management software, an energy monitoring platform connected to meters. It automates collection and analysis, but remains an observation tool: it identifies drifts without being able to act on them.
This is where a BMS changes the nature of the exercise. A platform like SCORP-IO does not just measure: it cross-references consumption with operational data (room occupancy via the PMS in a hotel, usage schedules in a school, weather) and allows you to act directly on equipment from the same interface.
And what about regulations in all this?
Measurement has become an obligation. The Tertiary Decree requires buildings over 1,000 m² to declare their actual consumption annually on the OPERAT platform, with a reduction trajectory of -40% by 2030, -50% by 2040, and -60% by 2050. The BACS decree requires an automation and control system capable of precisely tracking and analyzing consumption. A Class A BMS, as defined by the NF EN ISO 52120-1 standard, meets both requirements with a single tool: the data collected for management is used directly for regulatory declarations, which are traceable and exportable.
In other words: the manager who instruments their building to drive performance achieves regulatory compliance as a byproduct. The one who instruments solely to comply misses the point.
Bottom line: measurement is the beginning, not the end
Measuring energy performance has never been an end in itself. Indicators, sub-metering, weather correction, and tools are only as valuable as the decisions they trigger: reprogramming, regulating, detecting, and verifying. That is the entire difference between a dashboard you look at and a building you actively manage. And that is exactly the promise of a modern BMS: turning every measured data point into a potential action.
FAQ: energy performance measurement
You might be interested in this
Explore more articles on energy management and smart buildings.


Ready to transform your energy management
Start with a personalized demo or a free audit of your facilities.
